Post - Blog
Non-energy costs in Europe
- 6 years ago (2020-01-09)
- Junior Isles

By Martyn Young Co-founder and Director of ZTP

PowerTransTech 2026
Energy invoices are comprised of four main elements, the wholesale cost of energy, the costs of getting energy to its point of consumption, taxes and levies and contributions to supplier margins. The wholesale costs and the margins are driven by market dynamics. The transmission, distribution, taxes and levies are driven by policy.
The UK commenced energy deregulation in the 1990s and has been a major influence in Europe in developing a model to incentivise innovation via competition and market forces, an evolution that continues as we head towards a carbon reduction agenda. The UK commenced looking to reduce consumers bills with a model of driving productivity in the sector by setting transmission and distribution organisations targets against the Retail Price Index (RPI-X model), before moving in 2009 to Revenue + Incentives + Innovation + Outputs (RIIO model), which is currently still in place.
This move to a decentralised framework has been controlled by national regulators such as the UK’s OFGEM. In 2009 the EU adopted the Third Energy Package which established the Agency for the Co-Operation of Energy Regulators (ACER) to oversee the national regulators, ensuring they operate transparently and impartially. These bodies have had significant control in establishing the methodology around transmission, distribution and metering costs.
The Taxes and Levies are driven by national and regional government policies. Even in the UK we find differences in Northern Ireland. In some countries charges may even be levied at local level, giving a wide disparity of organisations with an input into energy charges. Given that these legislative bodies generally have different boundaries to transmission and distribution companies this adds further complexity and levels of charge.
If we look at the comparative average cost before VAT of natural gas to industrial customers in 2017, the last complete set of data from EU statistical publications, we see the top five countries in terms of highest cost were Finland, Sweden, Germany, Denmark and Lithuania.
It is interesting to note that while the UK has generally not extensively applied levies and taxes on the gas network this is not typical of much of the rest of Europe. In Denmark these comprised almost 36 per cent of a typical bill in 2017 according to ACER.
Fig 1. Top European tax and levy proportions of a gas bill 2017 – source ACER
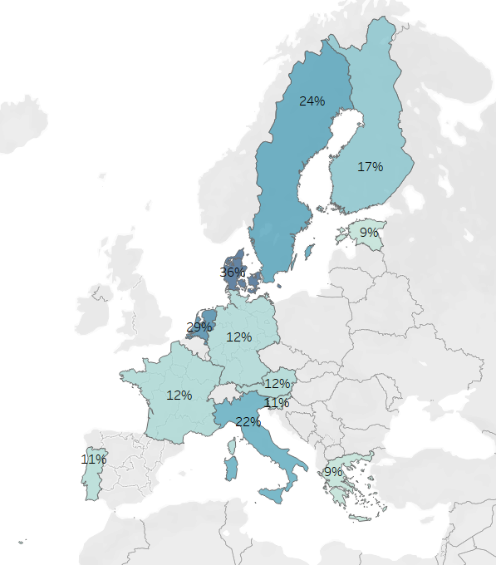
The relative cost of distributing gas in different geographies also causes discrepancies in the non- energy component with distribution costs in France reaching 39 per cent of the bill, and Lithuania 35 per cent, whereas in the Netherlands the distribution component is only 17 per cent. It is noted that some of this variation may be due to the relative importance of gas in the heat network with distribution costs in the Ukraine being some 24 per cent lower than in Spain and Portugal.
The comparative top five ranking of the highest industrial power cost in Europe is Germany, Italy, Cyprus, Montenegro and the UK.
In Fig. 2 we can see that, ignoring VAT, the energy element of a typical power bill was less than 18 per cent in Denmark in 2017, whereas in the UK it was approximately 55 per cent. It is observed that since 2017 the non-energy cost of UK power has risen.
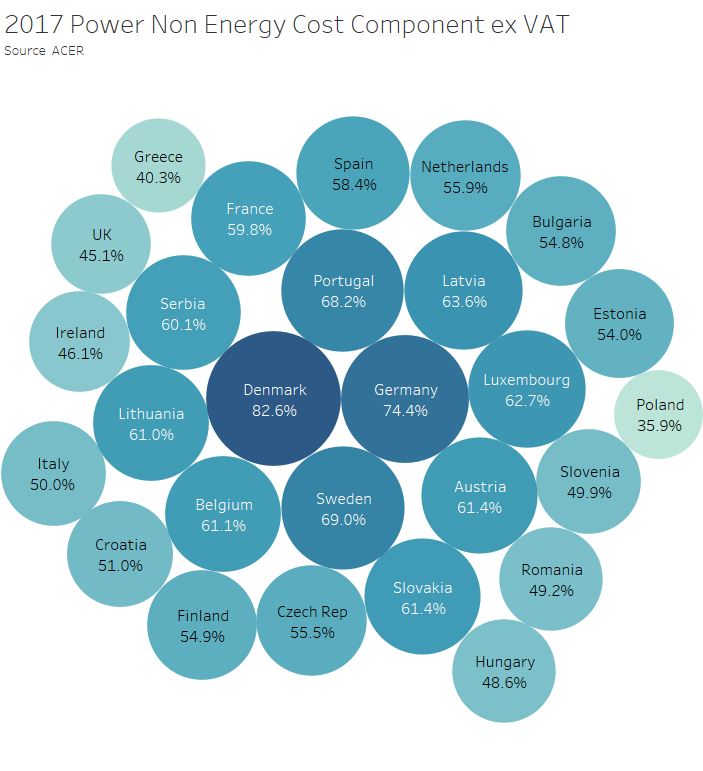
Denmark has the highest non-energy costs as part of the bill with a very high level of energy taxes and levies, 65 per cent of the pre-VAT bill for power, although it is noted that this will be reducing as they will phase-out the Public Service Obligation by 2022. Denmark has invested heavily in wind power and other renewables with the intention, like the UK, of being carbon-zero by 2050.
We can contrast this with Poland where non-energy costs make up only 35.9 per cent of the power invoice. Here the main power generation is from hard coal and lignite (79.6 per cent) with renewables only comprising 7.2 per cent of power generation, and the government putting up barriers against developing wind. Poland does benefit from its neighbour Germany exporting excess renewable production in times of high wind. Like Denmark Poland has no nuclear production. Here taxes and levies are low, but interestingly the price of electricity is higher than Slovakia and Hungary, which have higher tariffs.
According to OFGEM Belgium has the highest power prices in Europe, just ahead of Ireland and Spain, although that is not reflected if just Industrial customers are analysed. It has a high dependence on energy imports through interconnectors with its neighbours. Belgium is a complex market with the three regions, Wallonia, Flanders and Brussels having their own distribution networks and local distribution levies so that distribution makes up 34 per cent of a typical bill with an additional 19 per cent for federal taxes and 9 per cent for transmission.
The complexity of the make-up of the non-energy costs increases where the number of transmission and distribution companies has been allowed to grow. If we look at Germany there are over 850 Distribution Network Operators for power, four main transmission companies, and 695 gas distributors working over 16 main gas transmission networks. The taxes are also set at regional level by 16 regional regulators as well as the main regulator setting national levies.
This non-standardisation across Europe means that even with a Single Energy Market for wholesale costs, we are a long way off having a single way of costing retail energy. Indeed the complexity is such that to forecast accurate energy costs in some countries it is necessary to go into a lot of granular detail for each site and meter. If cost forecasting is to improve for business more use of systems that map this detail and combine with consumption and wholesale cost projections would be the optimum route.
Author: Martyn Young co-founder and director of ZTP, an energy software and management consultancy
www. ztpuk.com