Post - Blog
Decision time for oil & gas?
- 2 years ago (2023-08-08)
- Junior Isles
Heidi Hellmann and Kasparas Ragaisis at Marakon

EU-PVSEC 2026
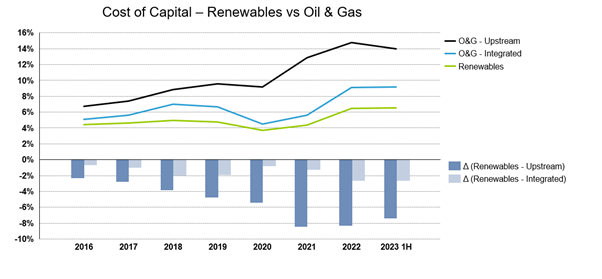
Over the last quarter, several European integrated oil & gas companies have dialled down their clean energy ambitions and dialled up their core fossil fuel businesses. In part this is a response to the very high commodity prices of 2022, the pressure from some investors for ever greater near-term returns and the persistent valuation gap between US and European oil & gas players. However, it is also a response to the limited success many oil & gas companies have had in their clean energy investments, renewables (solar and wind) in particular, and a ‘running out of patience’ with the low to zero returns they have generated thus far. Some oil & gas clients have not been able to get new renewable projects to clear their cost of capital and others have billions of capital already invested but earning low returns. This frustration is not surprising and is consistent with the trend we are seeing in the diverging costs of capital between oil & gas companies and renewable players.
Findings
Since 2016 we have seen a persistent gap in the cost of capital for renewable companies versus oil & gas companies. This differential has continued to widen (ignoring 2020, which was an anomalous year) and is particularly striking when comparing renewable firms with pure upstream oil & gas companies. The gap is now quite material with the cost of capital for renewable companies averaging ~6.5% as compared to ~9% for integrated oil & gas companies and ~14% for upstream focused oil & gas companies. [1]

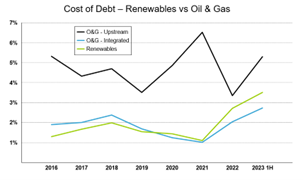
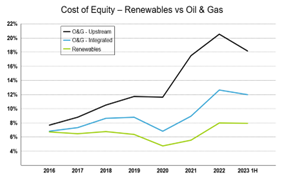
This differential is largely driven by a change in the cost of equity. Cost of debts for renewables and integrated oil & gas companies have tracked relatively closely with both experiencing a spike in the last 18 months with the cost of debt for renewable players actually increasing more than for oil & gas players. However, the cost of equity has consistently and increasingly diverged across all 3 types of companies from 2016 onwards.
Causality
Multiple factors may be affecting this change and thus it is difficult to determine which is the primary driver.
- Policy . It may be that we are starting to see the impact of climate change policy in Europe. This is supported by a report recently published by Oxford Sustainable Finance, which found a similar differential in cost of capital between high and low emitter companies in Europe, but did not find the same differential for firms based in other regions where climate policy has been less consistent. [3]
- Transition Risk . It may be that investors are beginning to price in a higher cost of carbon or are anticipating increased transition risks for the oil & gas companies.
- Renewables Maturity . At the same time investors may becoming increasingly comfortable with renewables risk as the sector matures, technology is derisked and companies scale and become more diversified.
The changes in cost of capital are likely influenced by all three.
Impact
Regardless of the cause, the impact is very real, and it is creating a problem for oil & gas companies. The differential in cost of capital is making oil & gas companies less competitive than renewable companies and is consequently hampering their ability to transition. Whether one is bidding for offshore wind licenses or the acquisition of a clean tech company, margins are thin and having a cost of capital that is 2.5% higher than one’s competitors is a material disadvantage.
The oil & gas companies will need to address this structural weakness. Should they withdraw from renewables and leave it to the pure players, who are advantaged by a lower cost of capital? This would in essence be adopting a ‘play-to-the-end’ or ‘last-one-standing’ strategy. Alternatively, should they adopt a different investment model to account for the differential in cost of capital? For example, companies could ring fence renewable and other clean energy investments into a separate division and apply a different, lower cost of capital from their core business areas. This assumes the investment opportunities in the core business can support an offsetting, higher than average cost of capital, which may be more consistent with the cost of capital for the pure upstream oil & gas companies. The answer is not obvious and will differ for each company, but the differential in cost of capital is something chief strategy officers and chief financial officers need to consider as they develop their future portfolios and financial frameworks.
Heidi Hellmann is a director and Kasparas Ragaisis an associate with Marakon. The views expressed herein are the views and opinions of the authors and do not reflect or represent the views of Charles River Associates, Marakon or any of the organisations with which the authors are affiliated.
[1] Marakon analysis based on Eikon data for the following European-based companies: 25 upstream oil & gas, 10 integrated oil & gas and 23 renewable companies. Sector averages are weighted by market cap.
[2] Cost of debt calculation is based on market value of debt rather than book value of debt
[3] Energy Transition and the Changing Cost of Capital: 2023 Review, Oxford Sustainable Finance Group, Xiaoyan Zhou, Christian Wilson, Anthony Limburg, Gireesh Shrimali, Ben Caldecott. March 2023


